Pattern Analysis & Visualization of a Comedy Database
As a combination stand-up comedian and tech nerd, I maintain a database of all my jokes. The database is a single table that has an entry for each joke in each set I’ve ever done.
Objective: Use this data to determine if some jokes perform better or worse based on what joke preceeds them or what other jokes are told within the same set. In general, the idea is to address the overall question of how much the proximity of (relatively independendant) jokes matters for a successful set. This helps in planning the optimal setlist for future shows.
Tools & Libraries Used:
SQL/MySQL
JavaScript: Threejs
Python: Pandas, networkx, PyVista, fuzzywuzzy
Workflows: There are two workflows detailed here. The first examines a group of high-scoring jokes and identifies their ideal predecessors—that is, the best jokes to tell beforehand. The second workflow is similar but takes a single jokeid as input and analyzes which other jokes tended to co-occur with it in high-scoring sets (i.e., sets with above-average scores for that jokeid). Each workflow pulls data from the database, performs an analysis, and provides a visualization of the results, using different visualization tools. Below are overviews of the components:
The Database
The MySQL database spans roughly 10 years and has roughly 12,000 entries. Each joke entry has the following fields:
jokeid is the name of the joke, it’s a word or phrase
date the joke was told
venue location where I told the joke
score how well the joke did (volume of laughter on the recording)
id autogenerted primary key, these are in sequential order and represent the order in which the jokes were told (and entered into the database).
a set, as referred to throughout this document, is a collection of jokeids which were all told at the same venue on the same date in order of ‘id’.
Here are the datatypes used in the SQL table
+--------+--------------+------+-----+---------+----------------+
| Field  | Type         | Null | Key | Default | Extra          |
+--------+--------------+------+-----+---------+----------------+
| jokeid | varchar(200) | YES  |     | NULL    |                |
| date   | date         | YES  |     | NULL    |                |
| score  | int          | YES  |     | NULL    |                |
| venue  | varchar(100) | YES  |     | NULL    |                |
| id     | int          | NO   | PRI | NULL    | auto_increment |
+--------+--------------+------+-----+---------+----------------+
Workflow 1
For each jokeid in the table, for each set that that joke appears in, the goal is to get the jokeid score and also get the jokeid of the joke that precedes it in the set (excluding when it’s the first joke in the set). Based on that, for each jokeid, the goal is to determine, overall, what is the best joke to precede it? Or rather, how often does a given jokeid get a high score when another specific jokeid precedes it?
- Extract: The data must be extracted from the database using a SQL query that organizes the results appropriately. This query retrieves jokes (j1) that have at least 10 entries grouped by jokeid (excluding brand-new jokes), and joins them with their immediately preceding joke (j2) from the same date and venue, based on a sequential ID relationship. It includes only joke pairs where both the current and preceding jokes belong to well-represented jokeids (i.e., with ≥10 entries). The query is executed from within the main Python script using the mysql.connector library.
    SELECT j1.jokeid AS current_jokeid, j1.score AS current_score, j2.jokeid AS preceding_jokeid
    FROM jokes j1
    LEFT JOIN jokes j2
    ON j1.date = j2.date AND j1.venue = j2.venue AND j1.id = j2.id + 1
    WHERE j1.jokeid IN (
        SELECT jokeid
        FROM jokes
        GROUP BY jokeid
        HAVING COUNT(*) >= 10
    )
    AND j2.jokeid IN (
        SELECT jokeid
        FROM jokes
        GROUP BY jokeid
        HAVING COUNT(*) >= 10
    )
    AND j1.score IS NOT NULL;
- Load: The results of the query are then loaded into a Pandas dataframe which is like a spreadsheet or table made of rows and columns. It helps organize data, making it easier to sort, filter, and do calculations—similar to using Excel, but in Python.
- Fuzzy matching: Since the data is manually entered there are typos and inconsistencies in naming so fuzzy matching is used to equate similar joke names. The script iterates through all the jokes and groups by similarity based on a selected threshold. This process uses the fuzzywuzzy library to operate on the Pandas dataframe.
- Analyze: Joke performance is analyzed by comparing each joke to the one that came before it, calculating which preceding joke tends to lead to higher scores. It filters out incomplete data, computes average scores, and identifies the most consistently high-performing joke pairings.
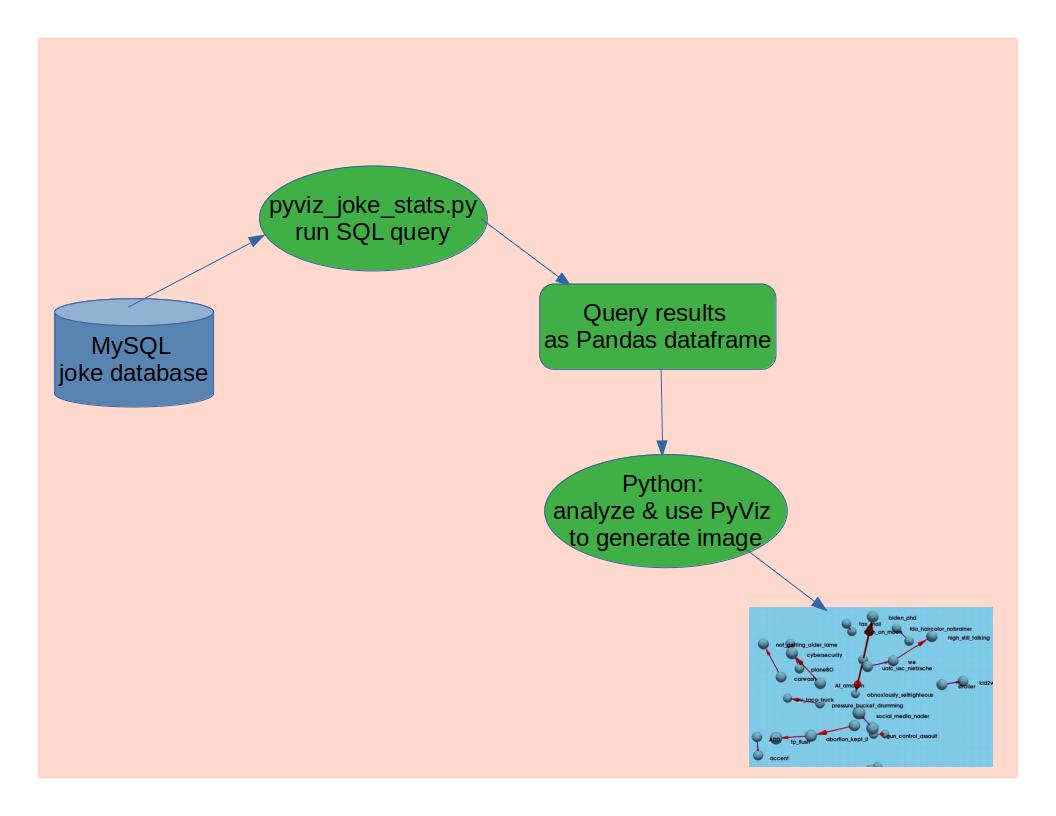
- Visualize: NetworkX and PyVista are used to create a 3D, interactive visualization of joke relationships, focusing on the top 20 joke pairs where a preceding joke is strongly associated with high performance of the next joke. It builds a directed graph (NetworkX.DiGraph) where each node is a joke and each edge represents a strong preceding-following relationship (based on score count). The positions of jokes (nodes) are determined using a 3D force-directed layout, which helps spread them out naturally in space. PyVista is used to draw each joke as a small blue sphere and connect related jokes with blue lines and red arrows showing direction (from preceding to current joke).
Overall, the process produces a spatial, intuitive representation of which jokes tend to “set up” other successful jokes. The full python script is available here: pyviz_joke_stats.py
Workflow 2
Given a specific jokeid, the analysis looks at jokes that most frequently co-occurred with it when it performed well and then graphs those results.
- Extract: The data must be extracted from the database with a SQL statement that organizes the results appropriately. This query retrieves all sets where the jokeid of interest got an above average score.
SELECT t1.jokeid, t1.date, t1.venue, t1.score FROM jokes AS t1 JOIN ( SELECT date, venue FROM jokes WHERE jokeid = '{args.jokeid}' AND score > (SELECT AVG(score) FROM jokes WHERE jokeid = '{args.jokeid}') ) AS jokeid_sets ON t1.date = jokeid_sets.date AND t1.venue = jokeid_sets.venue WHERE t1.jokeid != '{args.jokeid}' ORDER BY t1.date, t1.venue, t1.score DESC; - Fuzzy matching: Since the data is manually entered there are typos and inconsistencies in naming, so fuzzy matching is used to equate similar jokeids. The script iterates through all the jokeids returned from the query and groups them by similarity based on a selected threshold using the fuzzywuzzy library.
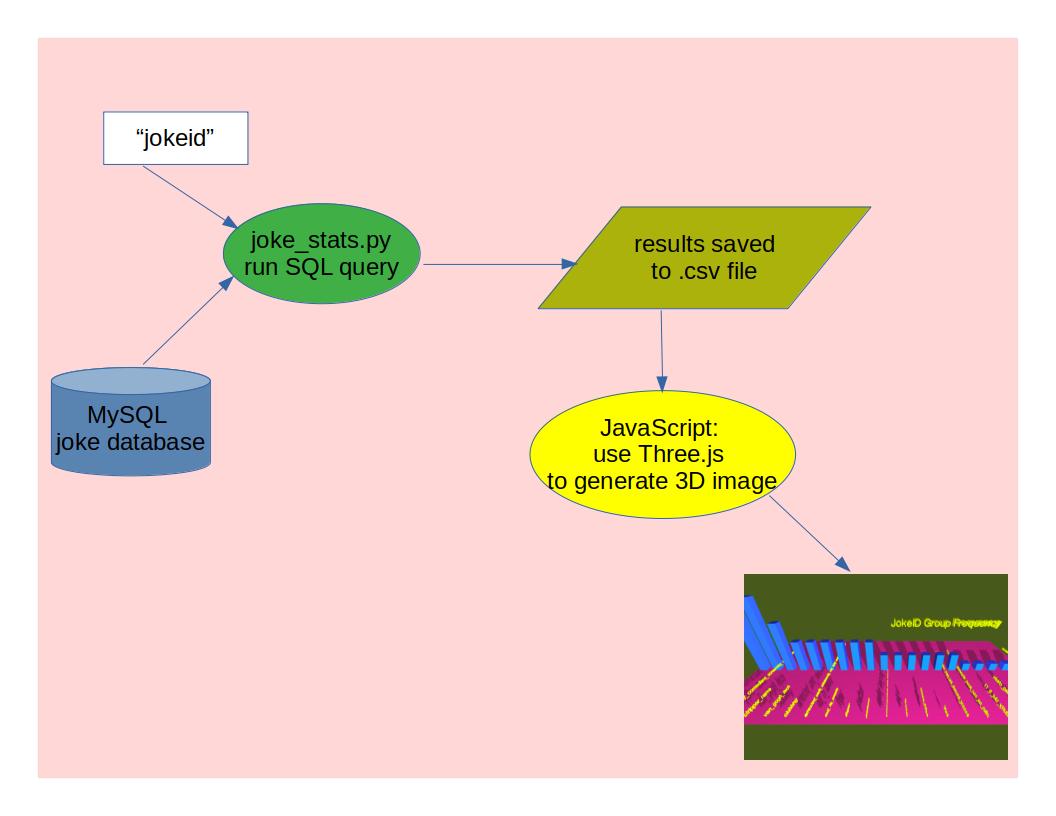
- Analyze: This analysis looks at a specific jokeid to determine the best set options (jokes to accompany it) for that particular joke and presents the results in a visually appealing 3D scene. Python is used for the analysis, which outputs a CSV file, and Three.js is used for visualization, taking that CSV file as input. The visualization below shows the results of an analysis for the joke named ‘AI_killing_poetry’, highlighting the top potential jokes that are strong candidates to co-occur with it in a set. The analysis is performed using [joke_stats.py[(https://github.com/skenny24/analytics_fun/blob/main/joke_stats.py), and the visualization is handled by joke_id_set_frequency.js, which leverages JavaScript’s powerful 3D library, Three.js.
- Visualize: Three.js is used to generate a bar graph displaying the frequency of the top, co-occurring jokes (the jokes that most frequently co-occur with the jokeid of interest).
